

*This post is the continuation of a prior entry. Read Part 1 here.
This next map set illustrates how we can apply the previously discussed single-family home market analysis to agency loan portfolios that stand behind Credit Risk Transfer (CRT) bonds issued by Fannie Mae and Freddie Mac. The CRT market is the most important institutional capital market that no one outside of the bond markets has ever heard of. It is essentially intended to bring the collective insights of the smartest and most experienced mortgage credit investors to bear on the credit risk management of the quasi-government mortgage agencies. We believe this to be the most important sector to address in achieving a gradual transition to a more climate-resilient financial system.
These maps display aggregated DeltaTerra Klima™ CRT data for 7.6 million loans with a combined $1.6 trillion in outstanding balances. For each loan that serves as a reference loan in a CRT deal we ingest anonymously geospatially linked AAL estimates from ICE Climate (formerly risQ prior to their December acquisition by ICE) and use our own algorithms to fill in holes and recalibrate nascent academic techniques based on our own research into data from NOAA, FEMA, NRI, NFIP, SBA, and Verisk PCS. Then we assess the income shock and home price depreciation risk to ascribe a climate-adjusted Loan-to-Value (LTV) ratio and climate-adjusted Debt-to-Income (DTI) ratio for each loan. Lastly, we use traditional mortgage behavioral models to measure expected losses in the scenario of interest (the Klima Base scenario in the case of this newsletter).
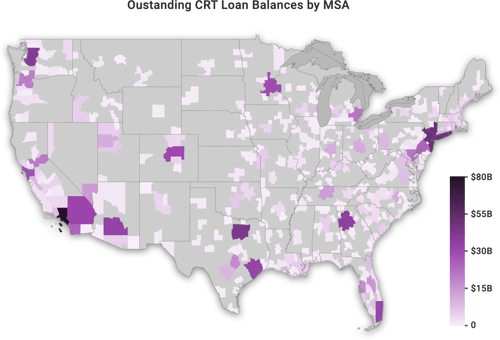
1) Credit Risk Transfer (CRT) reference loan balances outstanding – Major MSA granularity based on loan-level disclosures directly from Fannie Mae and Freddie Mac.
The agencies can only disclose the location of a loan in terms of the Metropolitan Statistical Area (MSA). More than 90% of balances are in one of these major metropolitan areas shown on the map below.
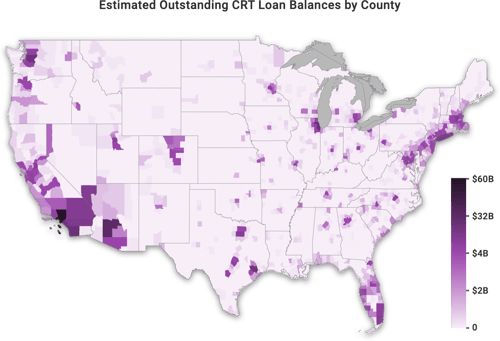
2) CRT balances outstanding county estimate – Balances assumed to be distributed across counties within an MSA or rural state location proportionally to the stock of homes.
To visualize an estimate of county exposure without breaching borrower privacy protections, we assumed that loan balances are distributed across counties within an MSA based on the distribution of the stock within that market.
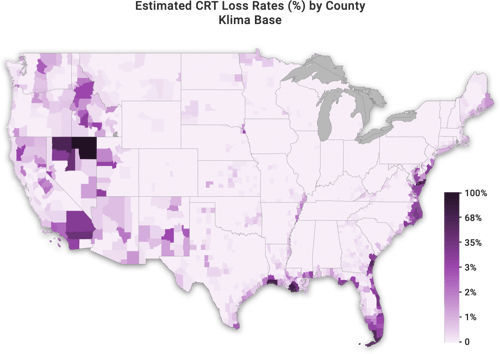
3) Klima Base scenario CRT loan loss rate – Base scenario Klima loan losses for a county divided by CRT estimated balances in the county.
Klima loss rates in a region depend on many factors. Scenario HPD risk for the region certainly, but also differences in the credit quality for the loans being stressed. Size, credit score, original LTV, original DTI, mortgage rate, and other factors are all considered in the estimation of scenario expected loss rates. While loan loss estimates are derived using location-precise risk estimates the locations themselves are blinded for privacy reasons. For illustrative purposes, we distributed loan losses to counties within a known MSA proportionally based on Klima Base AMVL for the housing market in the region.
4) Klima Base scenario CRT loan losses - Total Klima Base scenario loan losses in dollars.
While regional scenario loss rates are important when making allocation decisions, for a known portfolio allocation like the existing CRT universe, a visualization of absolute dollars at risk from a region is more meaningful. For instance, loans in Elko County in northeast Nevada are expected to suffer very high loss rates in a rationalization as illustrated on the previous map. However, because there are many more loans at risk in Riverside, CA where loss rates are expected to be somewhat more moderate, the risk to the overall CRT portfolio is much greater.
 Deal-Level Exposure Metrics
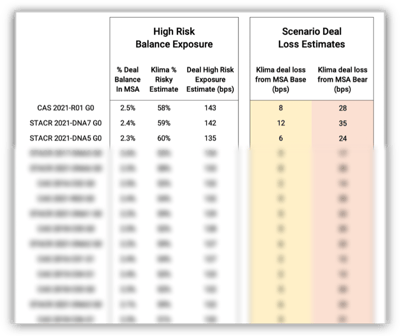
Fixed income investor clients who have studied these maps will probably wonder about their CRT exposure the next time wildfire risk looms large in the Southwest. Based on specific use cases presented to us by clients, we developed deal level exposure estimates and embedded them in our new map GUI. As a hazard event unfolds, a client need only click on an area on the map to get detailed information about the risks in that area as well as regional exposure metrics for each CRT deal.
The specific property location for an agency loan can never be revealed in an investment analysis because of important privacy laws. However, it is possible to identify the property within a secure “black-box” and return location-precise risk metrics using techniques that don’t compromise borrower privacy. Our friends at ICE Climate (back when they were just a little startup called risQ) probably spent more money on legal fees than technology to master this important capability!
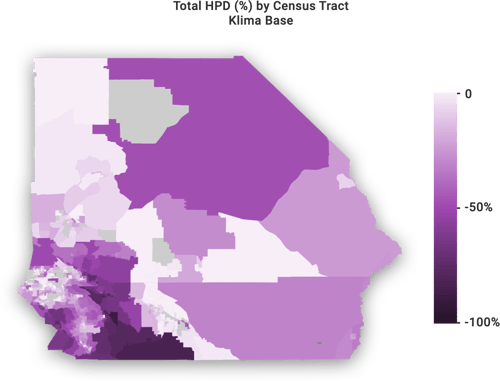
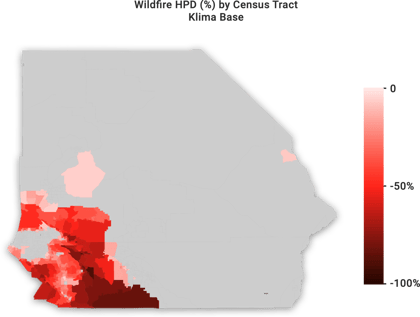
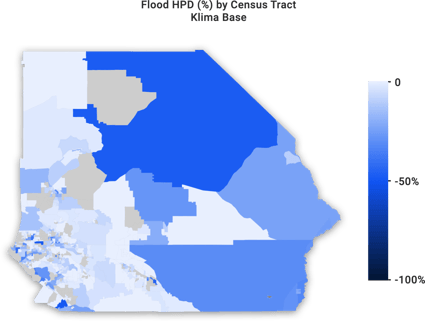
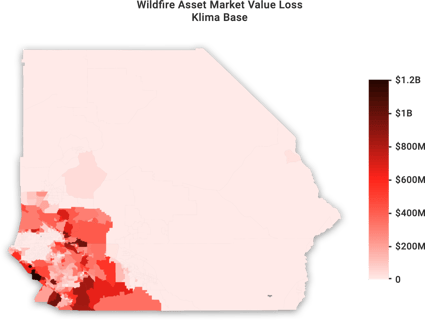
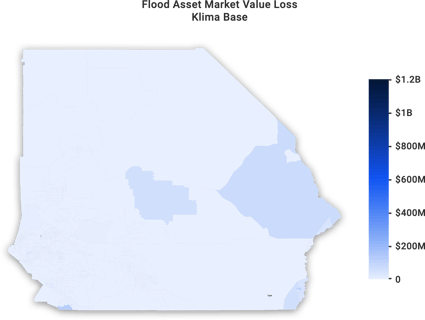
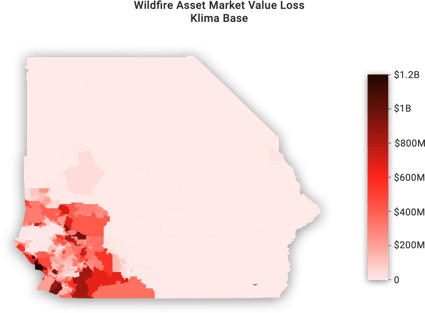
Given the same personally identifiable information (PII) considerations, we cannot show actual balance distributions on a map more granularly than at the MSA level, regardless of our ability to locate a property using statistical methods. Instead, we show the distribution of risk by census tract across the entire MSA market. For instance, in the maps below of the Riverside-San Bernardino-Ontario MSA, risk is clearly concentrated in the southwest part of the region. An investor may be inclined to reduce risk in the region if existing wildfires or weather conditions are threatening the most at-risk communities like Murrieta, Temecula, and the Temescal Valley.
Riverside HPD
____________________________________________________________
Riverside AMVL
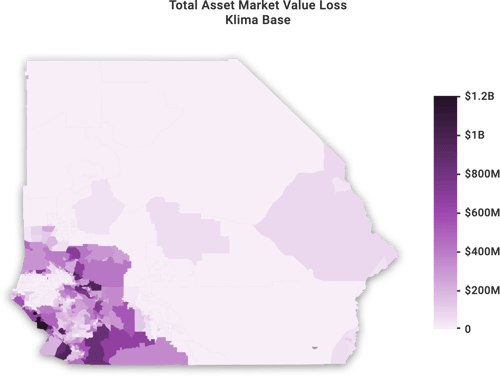
____________________________________________________________
If an investor does decide to reduce risk in this region, our deal level exposure metrics can serve as a powerful and immediate guide. For instance, if one owned the B2 tranche from the STACR 2021-DNA7 transaction, they may want to try replacing the position with a less exposed B2 until the threat has been resolved. The B2 tranche in this transaction only has 26bps of structural protection and would default if the Klima Bear scenario came to pass in Riverside where our models anticipate 35bps of deal losses. High-yield bonds like this (currently yielding 8-9%) can withstand some default losses without become instant losers, but this type of idiosyncratic risk exposure at the very bottom of a capital structure can be very damaging to pricing and liquidity and doesn’t leave much room for other problems down the road.
Let us know what you think of our new Klima features! We are entering a new stage of product development at DeltaTerra and we look forward to discussing this work with investors, lenders, analytics firms, policymakers, and others who could use a little extra climate risk know-how in their real estate risk management processes.
Published on Feb. 18, 2022.
Klima Maps reflect DeltaTerra’s estimates of the probabilities and severities of future losses based on data sources we believe to be reliable (including principally ICE Climate, FEMA, IPCC, NOAA, and Verisk PCS) under certain assumptions ç, all as more fully disclosed in the maps and reports available to subscribers. Loss probabilities are estimates of the likelihood of a range of outcomes, not predictions of any specific outcome. If the data or assumptions prove to be incorrect, different probabilities would result and could be better or worse than those shown. Klima Maps are not intended as investment, transactional, or insurance advice to any person or regarding any specific security or other asset.