

One of the ways that DeltaTerra has differentiated itself from other climate risk measurement efforts has been our laser focus on developing decision-useful climate risk measurements that slide seamlessly into the workflow of the various market practitioners whom we serve.
• Property investors need to know the potential impact of increasing hazard events and ownership cost expectations on market risk premia and property values.
• Lenders need to know the impact of climate risk on asset values and borrower ability-to-pay.
• Whole loan investors need to be able to estimate stress scenario loan loss expectations.
• Mortgage-backed securities investors need to know how these risks interact with a specific bond offered through a securitization vehicle.
• Sustainable investors (ESG, Stewardship, SRI, Impact) and policymakers need to measure the potential social costs and benefits of capital markets transitions and systemic resiliency efforts (ie. Risk Rating 2.0).
Our intense focus on developing these tools has allowed us to provide our clients with a powerful analytics platform offering turnkey risk measurement capability across many important capital markets. To further the depth and transparency of these tools, we have begun an exciting new phase of development to help our clients visualize various DeltaTerra Klima™ risk metrics across different geographical areas using interactive maps. This functionality could be used, for example, to evaluate the risk that a given storm (or other climate-driven phenomena) represents to specific securities. We're excited to announce our newest platform feature – DeltaTerra Klima™ Maps.
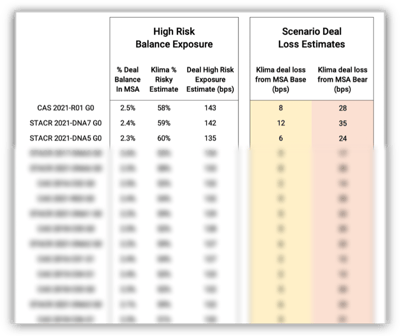
This initial set of Klima maps visualize our translation of expected flood and fire damages into capital market risks for the single-family home and mortgage markets. Our interactive version for clients allows a user to zoom in on a particular region and obtain more detailed information on the market, as well as our estimates of deal specific risk in the region (ie. total Klima scenario losses in the region for each agency mortgage deal).
%20by%20County%20Klima%20Base-1.png?width=600&name=Estimated%20CRT%20Losses%20($)%20by%20County%20Klima%20Base-1.png)
 Single-Family Home Market Maps
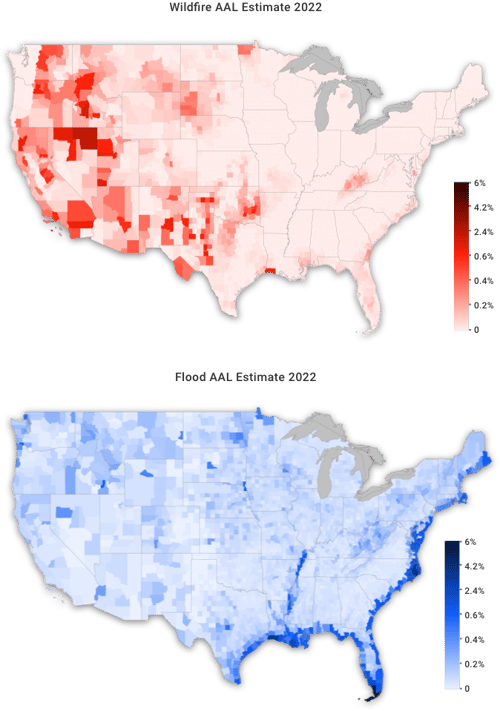
1) Current average annual loss (AAL) estimate – Probabilistic damage expectations from fire and flood in 2022 in terms of expected annual damages divided by total building replacement value.
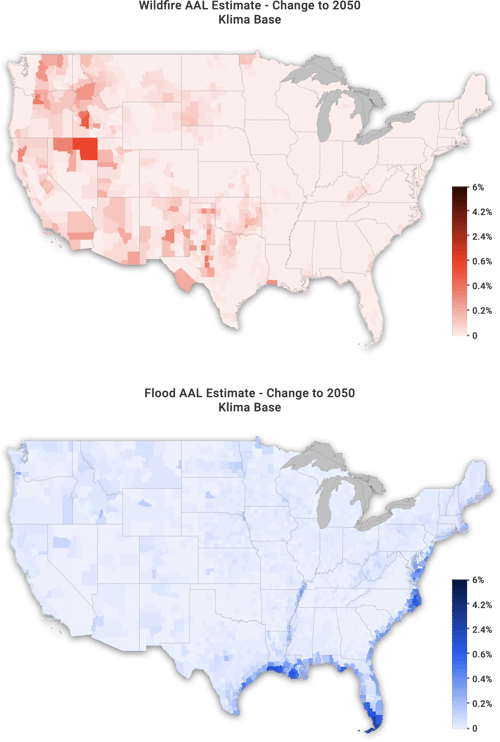
2) AAL change to 2050 in Klima Base – Damage rate expectation in 2050 in the Klima Base scenario minus the current estimate.
Property damage risk is expected to increase meaningfully over the next 30 years, even in the somewhat optimistic IPCC scenario, RCP 4.5, to which the Klima Base scenario is calibrated.
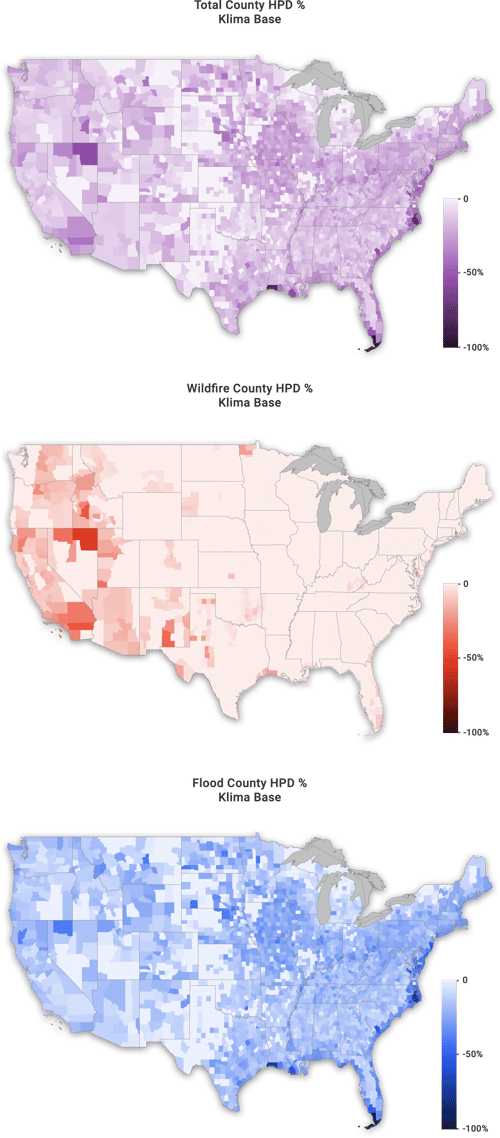
3) Home price depreciation risk (HPD) - county level home price depreciation risk estimate if property buyers in the market began pricing in damage risks from fire, flood, or both.
When not only insurance costs but expected insurance costs increase for a home, it will be worth less to the next buyer. We used market behavioral models to estimate the impact of both declining housing utility and uncertainty-driven market risk premia increases on regional home values in a rationalization.
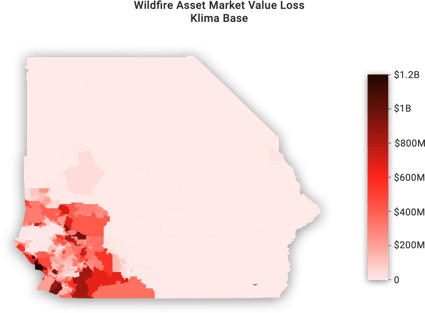
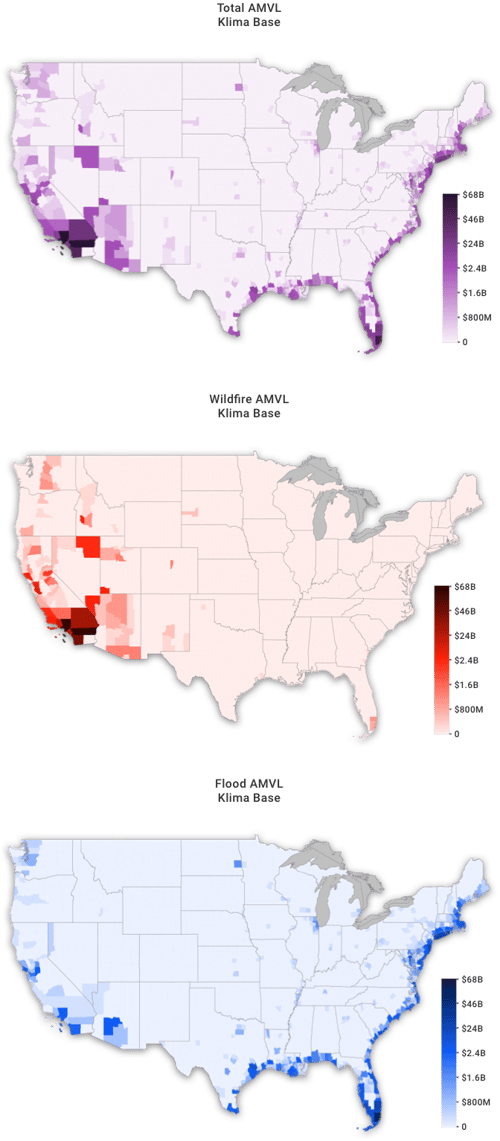
4) Asset market value loss risk (AMVL) – total Klima Base scenario home market value-at-risk in dollar terms.
From the systemic and market portfolio perspectives, the greatest risks are in regions with both high risk and high value-at-risk. We rolled up the total home value dollars at risk in each region to illustrate the regions of greatest concern from a market portfolio perspective.
Published on Feb. 18, 2022.
Klima Maps reflect DeltaTerra’s estimates of the probabilities and severities of future losses based on data sources we believe to be reliable (including principally ICE Climate, FEMA, IPCC, NOAA, and Verisk PCS) under certain assumptions regarding climate, all as more fully disclosed in the maps and reports available to subscribers. Loss probabilities are estimates of the likelihood of a range of outcomes, not predictions of any specific outcome. If the data or assumptions prove to be incorrect, different probabilities would result and could be better or worse than those shown. Klima Maps are not intended as investment, transactional, or insurance advice to any person or regarding any specific security or other asset.